Field mapping and NDVI by drone – see where your field really needs help
Published: 19 October 2026
Drone field mapping replaces guesswork with a concrete map. Instead of walking the field and checking a few spots, you get a picture of crop condition across the whole area – metre by metre. From the NDVI map you can see straight away where the crop is weaker, and then you can fertilise and spray only where it makes sense.
We do everything in one place: the DJI Mavic 3M flight, the NDVI map, dividing the field into zones and, finally – if you want – an application with a DJI Agras drone at a variable rate.
What is NDVI – in two sentences
Healthy plants absorb red light (for photosynthesis) and strongly reflect near-infrared. A plant that is stressed, diseased or short of nutrients reflects differently – and a multispectral camera picks this up before you can see it with the naked eye.
The index is calculated with a simple formula: NDVI = (NIR − RED) / (NIR + RED). The result falls on a scale from −1 to +1:
| NDVI value | What it means | Colour on the map |
|---|---|---|
| closer to 1 | dense, healthy canopy | green |
| approx. 0.3–0.6 | weaker or thinner crop stand | yellow |
| closer to 0 | bare soil, no plants | red / brown |
| below 0 | water, shadows | grey / blue |
What an NDVI map offers your farm
- Early warning – water stress, disease, pests and nutrient deficiencies show up before they cost you yield.
- Field zones – you see which parts of the field have high potential and which are weak because of the soil.
- Variable-rate application – fertiliser and crop protection products go where they will work, and less where they won't make a difference.
- Checking treatments – before-and-after maps show whether a fertiliser or spray application worked.
- Field archive – maps from successive seasons let you compare years and plan better.
- Damage documentation – hail, drought, frost, wildlife – with affected area and coordinates.
Video: how a mapping drone works
▶ Play video (YouTube)A presentation of the DJI Mavic 3 Multispectral – the drone we use to map fields (in English). More about the drone itself: DJI Mavic 3M and NDVI – from map to spray application.
How we create an NDVI map – step by step
- We define the goal. Assessing winter survival? A nitrogen fertiliser plan? Hail damage? The goal determines the timing, flight height and what you receive at the end.
- We choose the date and weather. NDVI depends on light, so we fly in even lighting – not with a low sun and long shadows, and not in strong wind. The Mavic 3M has a sunlight sensor that evens out differences between images.
- We plan an automated flight. We mark the field on the map and the drone flies parallel strips on its own. We set the height (usually 80–120 m), the resolution (a few cm per pixel) and the image overlap (approx. 70–80% forward and 60–80% sideways) so nothing is missed.
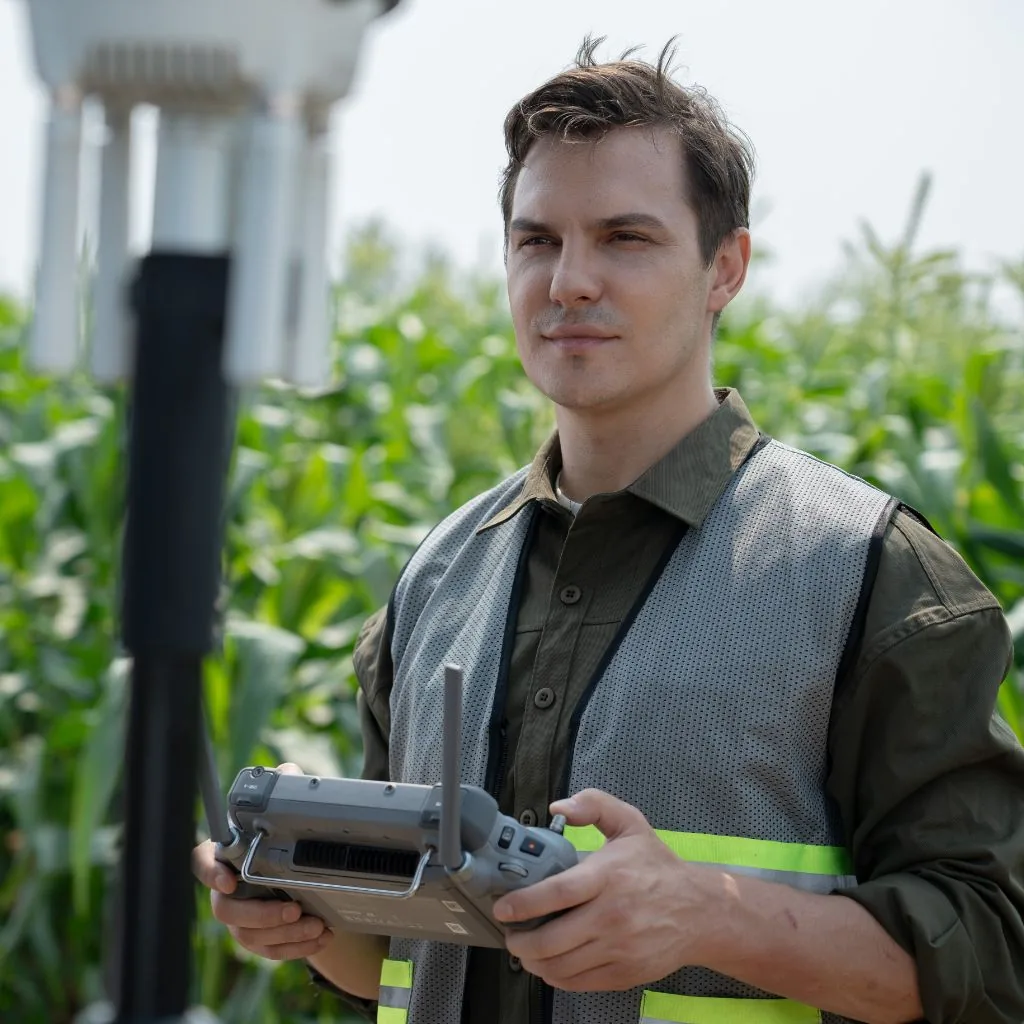
- Flight and on-site checks. The drone captures the images by itself while the operator keeps an eye on safety, battery levels and the RTK signal. After landing we check a few images straight away – if something is wrong, we repeat the flight the same day.
- We stitch the images into an orthomosaic. We combine hundreds of images into one accurate map of the field, with the position of every pixel (DJI Terra / DJI SmartFarm).
- We calculate NDVI and clean up the map. We remove anything that distorts the result: roads, ditches, buildings, cloud shadows.
- We divide the field into zones. We combine the map with what you know about the field: soil, yields, fertilisation history. That shows whether a weaker spot is a temporary problem or a permanent feature of the soil.
- We create a variable-rate map. Each zone is assigned a rate of fertiliser or product. The file goes to a DJI Agras drone or to the terminal of your spreader or sprayer.
- Application and checking the result. We carry out the application at variable rates, and the next flight shows whether the crop has evened out.
Which maps DJI software produces – not only NDVI
We process Mavic 3M images in DJI software (DJI Terra / DJI SmartFarm). A single flight produces an orthomosaic in natural colour and five vegetation index maps. Each one shows something different, so we match the index to the question you need answered.
| Map | Formula | What it shows | When it helps |
|---|---|---|---|
| NDVI | (NIR − R) / (NIR + R) | canopy density and “greenness”, biomass | overall field condition, season-to-season comparisons; saturates on very dense canopy |
| GNDVI | (NIR − G) / (NIR + G) | chlorophyll content – more sensitive than NDVI | early growth stages, water and nutrient deficiencies |
| NDRE | (NIR − RE) / (NIR + RE) | chlorophyll and nitrogen status, even in a dense canopy | mid- and late-season nitrogen fertilising, early detection of stress |
| LCI | (NIR − RE) / (NIR + R) | leaf chlorophyll | nutrient stress, disease, plant senescence |
| OSAVI | (NIR − R) / (NIR + R + 0.16) | vegetation, adjusted for bare soil | young crops, orchards, sparse canopy with a lot of visible soil |
NIR – near-infrared, R – red, G – green, RE – red edge (the band between red and near-infrared).
From an index map, the DJI software directly creates a variable-rate application map and a flight route for DJI Agras drones – with a rate assigned to each zone of the field. This way the map doesn't stay a “picture” but turns straight into a treatment.
What equipment we use – and why the Mavic 3M
| Item | What matters | What we use |
|---|---|---|
| Camera | NDVI needs the red and near-infrared bands. An ordinary colour camera gives only an approximate picture. | 4 multispectral cameras: green, red, red edge, near-infrared + 20 MP RGB camera |
| Positioning | Standard GPS can be off by several metres – too much for variable-rate application. | RTK – centimetre-level accuracy |
| Light | Changing sunlight during the flight skews the result. | Sunlight sensor recording with every image |
| Productivity | The fewer flights and batteries, the faster and cheaper the job. | Up to 43 min flight time, up to 200 ha in a single flight in optimal conditions |
| Software | Orthomosaic, vegetation indices, export to machinery (SHP, GeoTIFF). | DJI Terra / DJI SmartFarm – NDVI, GNDVI, NDRE, LCI, OSAVI and variable-rate maps for DJI Agras |
When to map during the season
- Early spring – winter survival of cereals and canola, frost damage, patches to re-sow.
- Start of rapid growth – nitrogen deficiencies, and the decision on top dressing and foliar feeding.
- Before fungicide applications – dense, humid patches of canopy, which are most exposed to disease.
- Drought – the spots that lose water fastest; guidance for irrigation and drainage.
- Before harvest – biomass distribution, a preliminary yield estimate and the harvest sequence.
- After damage – hail, frost, wildlife: documentation for insurance or compensation claims.
How much can you save?
In examples from Polish fields, presented by Poland's Agricultural Advisory Centre (CDR), NDVI maps saved product from 2% (levelling fertilisation) to 22% (nitrogen applied according to a drone map) and as much as 63% (herbicide spot-applied with a ground sprayer according to the map). The more variable the field, the greater the gain. On a uniform field, the map will confirm that a fixed rate is correct, which is also valuable information.
Mapping and application in one
You don't need to look for one company for maps and another for spraying. We map with a Mavic 3M drone, prepare the zones and the variable-rate map, and pass the variable-rate map on to your spreader or sprayer. We carry out drone applications where the rules allow: spraying in line with the product label (Act 36 registration) and SACAA RPAS rules, seed sowing on request, and fertiliser spreading where the rules permit.
Wildlife damage
Drone images let you measure accurately the area destroyed by wildlife such as bushpigs or antelope. A map with coordinates and the area in hectares is strong supporting evidence when assessing compensation or an insurance claim.
FAQ – frequently asked questions
How much does drone field mapping cost?
Price on request. It depends on the area, number of fields, distance and scope of analysis (an NDVI map only, or also a variable-rate map). We prepare a quote within 24 hours.
When is the best time to map a field?
Early spring (to assess how the crop came through winter), before top-dressing, before the main fungicide applications, after drought or hail, and before harvest. Mapping several times a season gives the most value.
Is a drone NDVI map better than a satellite one?
It has higher resolution, can be flown on a day of your choice – even under full cloud cover, when a satellite sees nothing – and is ready sooner. Satellite imagery is cheaper for regular monitoring of large areas. The two methods complement each other.
Will you carry out an application based on the map?
Yes. From the NDVI map we create a variable-rate map for your own machine or for a DJI Agras drone – spraying in line with the product label and SACAA RPAS rules, seed spreading at short notice, and fertiliser application by drone where permitted.
Is NDVI enough to decide on fertilising?
NDVI shows where plants are weaker, but not always why. It works best combined with a soil map, the field history and a check on the ground – we help you interpret it.
What maps besides NDVI does the DJI software produce?
Five indices: NDVI, GNDVI, NDRE, LCI and OSAVI, plus an orthomosaic and a variable-rate map for DJI Agras drones.
Sources and further reading
- rolnicy.com – Field mapping with a drone: how to create NDVI maps step by step (2026)
- DJI – DJI Terra user manual (vegetation indices, variable-rate maps)
- DJI Support – indices supported by DJI Terra
- DJI Agriculture – Mavic 3 Multispectral
- DJI Enterprise – Introducing DJI Mavic 3 Multispectral (YouTube)
- J. Mączyńska-Sęczek, CDR Brwinów, Warsaw branch – "Satellite imagery and drones in precision agriculture", KSOW conference, Łódź 2022 (PDF)
- U. Mahajan, B. R. Bundel – Drones for NDVI to Estimate Crop Health (AFHABEC-2016)
- Order an NDVI map of your field
- DJI Mavic 3M and NDVI – from field map to spraying
- Fertilising and seeding by drone – fertiliser without wheel tracks